Investigating Liner Equations Using Graphing Calculator
Overview:
Investigating Linear Equations unit consists of 6 graphing activities designed
to
help students explore and learn the concept of linearity using graphing
calculator,
an assessment rubric, and a self-evaluation form. These activities are not meant
to substitute but supplement the chapter on graphing linear equations.
Time:
Each activity takes 1-2 class periods.
Requirements:
• Students should have the basic knowledge of pre-algebra math concepts,
know about the four quadrants, ordered pairs, plotting points, and
functions; know the meaning of slope and x- and y-intercepts; for activity
#3, students should have mastered solving equations in two variables.
• Teachers should have the knowledge and skills of using the graphing
calculators. Students learn best when teacher demonstrate how to use the
graphing calculator.
• Teacher should prepare and give out handouts with instructions related to
the specific calculator in use. For example, Texas Instruments, Casio or
Sharp calculators are commonly used. In addition there is the Mackintosh
graphing calculator whose program can be downloaded into the class
computers.
Abstract:
The emphasis in this unit is on developing the slope-intercept form of the
linear
equation. In the first three activities, the student explores and learns about
the
slope and y-intercept of a line graph by graphing and seeing many graphs.
By activity 4 the student can write the equation of a given graph and check the
result on the calculator. Activity 5 and 6 are real-world applications.
Activity 6 however applies the concept of linearity to scatter plot. students
collect
data of weight versus height of their family members. Make a scatter plot, and
use the line of best fit to interpolate and extrapolate. The teacher guide the
students in using the graphing calculator to check their work.
Objectives:
This unit is designed to help the tactile and visual learners in my inclusive
8th
grade algebra class, learn and understand the concept of slope and linear
equations, and how the concept of linearity is applied in real world situations.
• Using the graphing calculator and interactive worksheet activities the
student will load a function into the calculator and immediately see its
graph.
• By graphing different lines, the student will see similarities and differences
in the graphs that lead to specific conclusions based on what they see.
• By answering the questions on the worksheet, the student will compare,
analyze, and make generalizations about the graph. .
• Providing these experiences, the student will begin to see how different
coefficients (slope) affect the shape of the graph.
• By examining the graphs they see, students will identify the x- and yintercepts
of the graph.
• By looking at a line graph, the student will figure out the equation of the
line in the slope-intercept form.
• Having students play with graphing calculators is fun. Students love fun. It
makes learning a desirable rather than hateful experience.
• By using the graphing calculator students engage most of their senses in
the learning process: touching with their fingers (kinesthetic), seeing
(visual), thinking and reasoning (cognetive), and articulating their thoughts
with their partners (auditory).
• Hence, by providing such experiences the teacher makes learning
equitable to all students in the classroom.
Algebra 1 CA Standards:
• Standard 5.0 – Students solve multistep problems, including word
problems, involving linear equations. (activities 3 and 4).
• Standard 6.0 – Graph a linear equation and compute the x- and yintercept
(activity 2).
• Standard 7.0 , 8.0 – Understand the slope for use in the point-slope
formula and for understanding parallel lines and pependicular lines
(activities 1, 2, 3).
National Board Standards:
• NB Standard I - Commitment to All Students:
"Accomplished mathematics teachers value and acknowledge the individuality
and worth of each student; … they demonstrate these beliefs by providing all
students equitable and complete access to mathematics".
• NB Standard VI - Learning Environment
“Accomplished mathematics teachers create stimulating, caring, and inclusive
environments. They develop communities of involved learners in which students
….work independently and collaboratively, and value mathematics.”
• NB Standard VIII - Technology and Instructional Resources:
"Accomplished mathematics teachersare knowledgeable about and, where
available, use current technologies and other resources to promote student
learning in mathematics."
Relationship between ETP and my Fellowship:
• Math in the work place at Intel
• Working at Intel was a very rich and inspiring experience. I was a member
of a team working on optimizing WIP (Work In Progress) delivery to
stations based on process flow and geographical location of work stations
in the Factory (Factory Layout). This kind of work involved a good
knowledge of math in both analyzing statistical data and reading and
intrerpreting graphs. So, I chose a topic for my ETP related to graphs –
graphing linear functions, to teach students the concept of linearity
between two variables; a topic that most students find difficult to
understand in the middle school.
• Technology in the work place at Intel
Technology becomes an essential part of learning now-a-days. Hardwares,
softwares, automated machines, all are incorporated to enhance learning,
training, communication, research, development, production, and sales at Intel.
When technology is used to aid instruction in the classroom it enhances the
teaching proces and optimises learning because it will reach not only the
auditory
learner but also the visual and tactile learner. So, I chose to use the
technology
inbeded in the graphng calculator so students play with equations and see the
result on their graphs.
• Well structured programs for optimal yield at Intel.
As a company, Intel is highly structured and this is reflected in its programs
and
activities. I chose well structured interactive activities for my ETP to help my
students learn the concept of linear relationships step by step and understand
the process and its reasoning before drawing conclusions.understanding the
process will ensure good results.
• On going research and development thriving for Excellence.
Intel engineers and administrators continuosly monitor and assess work in
progress to assure high quality production and optimal results. they invest in
research as a means for development: a pathway to excellence.
So by continually monitoring and assessing students learning and achievement
and working on areas that needs developing we can optimise the outcome of our
teaching.
Materials/ Resources Needed:
• Graphing calculator
• Graphing calculator guide/ teacher instructions handout
• Student’s Algebra Text Book: Prentice Hall, McDougal Littell, or other.
• Graph papers
Sources:
• Texas Instruments TI-83 plus Explorations.
• TI-83 plus Instructions booklet.
• Graphing Calculator Activities – Dale Seymour.
• Prentice Hall Algebra 1.
• Navigating through Algebra – NCTM.
• Math Forum - Ask Dr. Math.url
Activity 1
Graphing Lines of the Form y = mx
Objective: In this lesson you will see how the value of m affects the graph of a straight line.
1. Use the graphing calculator to graph each function and complete the table. An
example is done for you.
| Function | Value of m |
Sketch | x-intercept | y-intercept | Is the graph the same, steeper, or flatter than the graph of y = x (or y = -x)? |
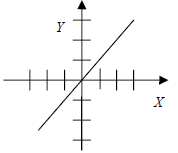
| y = x | 1 |
 |
(0,0) | (0,0) | The same as y = x. |
| y = -x | |||||
| y = 2x | |||||
| y = -2x | |||||
| y = 0.5x | |||||
| y = -8x | |||||
| y = -0.4x | |||||
| y = 0.05x |
2. Use the results to answer the following items.
a. What point does every graph in exercise 1 have in common? ___________________
b. Does the value of m affect the location of the x- or y-intercept?
__________________
c. If the graph lies in quadrants I and III, then m is (positive, negative).
Circle one answer
d. If the graph lies in quadrants II and IV, then m is (positive, negative).
Circle one answer
e. If m is positive, predict what will happen to the graph as m gets larger.
____________
_____________________________________________________________________
f. If m is negative, predict what will happen to the graph as ImI (absolute
value of m)
increases.
_____________________________________________________________________
g. Make a conjecture about the graph when m = 0.
_____________________________________________________________________
_____________________________________________________________________
Check your prediction by graphing the function on your calculator.
h. Summarize the role of m in the graph of y = mx. _____________________________
_____________________________________________________________________
____________________________________________________________________
____________________________________________________________________
3. For each of the following, write an equation of a line that fits the
characteristics. Verify
your answers with the graphing calculator.
a) A straight line in quadrants I and III steeper than y = 3x.
Equation: _____________________________________
b) A straight line in quadrants II and IV flatter than y = -x
Equation; ___________________________________
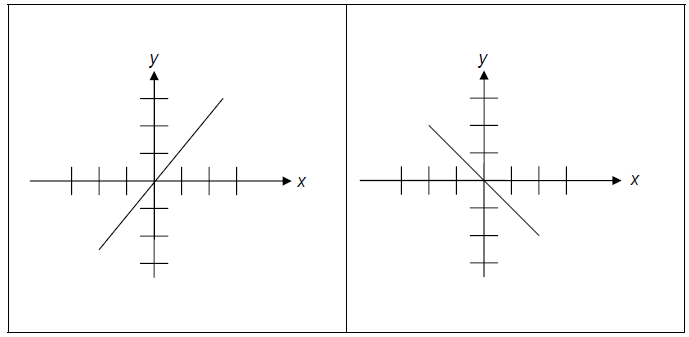
c) A straight line with the graphs shown below.

Equation: _________________________ Equation:
______________________
d) A straight line that lies between the graphs of y = 3.5x and y = 1.5x.
Equation: ____________________________


