


Set Builder Notation and Graphing Inequalities
I. Section P2 The real line.
A. Make sure you can do problems #9-32 on page 132. Please
do not turn in your work
for all of these problems.
B. For problems #13, 17, 21 and 27 on page 132, copy out
the problem onto your
homework. Solve the inequality given, showing your work. Express your answer in
interval notation and graph the solution set on the real line. Check your
answers in
the back of the book.
C. Consider the set
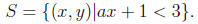
Write a paragraph explaining what you would do to figure
out how to graph this set
in the case that a > 0 (i.e. a is a positive number) and in the case that a < 0
(i.e. a
is a negative number). In your paragraph, compare and contrast the process and
the
solution in the two cases, indicating which steps are the same for both and
which
ones differ. Begin your paragraph with a topic sentence to make it more
coherent.
II. Section 2.4 Lines.
A. Read Section 2.4. There’s a ton of great stuff in that
section.
B. Make sure you can do problems #11-14 on page 189.
Please do not turn in your
work for all of these problems.
C. For problem #12, neatly copy the graph into your
homework. What is the equation
for the line? Answer in a sentence, “The equation for the line is....” Referring
to the
line in #12, express each of the following sets in set builder notation:
i. S1 is the set of all points that lie above the line.
ii. S2 is the set of all points that lie on the line.
iii. S3 is the set of all points that lie above or on the line.
III. Section 2.4 Lines.
A. Make sure you can do #41-52 on page 190. Please do not turn in your work for
all
of these problems.
B. Write up your solution to #46 and #50 on page 190,
explaining your work, and draw
the graphs on the same axes. Draw the graphs nice and big! Find the coordinates
of the point where the two lines intersect, and label it on your graph. Also
label all
x-intercepts and y-intercepts.
C. On a new set of axes (also nice and big!), graph the
set
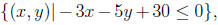
but instead of shading, fill the region with little + symbols. Make the border a
solid
line if it is included in the set and a dashed line if it is not included in the
set.
D. Add the graph of the set
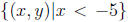 to your diagram from part (??). This
time instead of shading, fill the region with little
 .
In the intersection of the two
.
In the intersection of the two
regions, use ⊕’s.
The intersection of the two regions, i.e. the region where you drew ⊕’s,
is a graph of the set of points (x; y) such that the system of inequalities
holds.