


Quick Review of Trigonometry and Analytic Geometry
Multivariate statistics are used to summarize large
collections of numbers into (1) a smaller
sets of numbers or (2) graphs of low dimensionality. To fully understand both of
these
applications it is helpful to understand several key ideas from trigonometry and
analytic
geometry.
In today’s lecture we will review two common metrics for
measuring angles: (1) degrees and
(2) radians. We will then review the most common trigonometric functions and
demonstrate
how correlations can be represented as cosines between directed line segments
(i.e.,
vectors).
Measuring Angles
The size of an angle can be described in various metrics
just like the height of a chair
can be described in various metrics (e.g., in inches or meters). Two common
metrics for
describing angles are degrees and radians. Many psychologists are familiar with
the degree
metric from various “nonmathemathical” contexts. Persons who have taken
trigonometry
or calculus are no doubt familiar with the notion of radians since radian
measures are
found often in higher mathematics.
Degrees
Mathematicians often teach the twin notions of degrees and
radians with the help of a
circle of radius 1 (recall that the radius of a circle is 1/2 of the diameter).
A circle of
radius 1 is often called the unit circle. Regardless of a circle’s radius, a
circle can be
divided into 360 degrees. Notice in Figure 1 that when speaking of degrees, a
right angle
defines an arc that subtends 90 degrees of the circle. Other degree markers are
denoted
on the circle. 1° is one-ninetieth of a right angle.
Radian
When s is the length of the arc subtended by ∠ a, then the
radian measure of  . This
idea is illustrated in Figure 2.
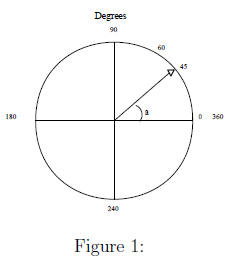
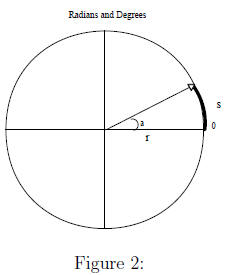
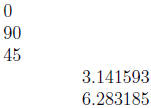
Figure 3 shows the sizes of some common angles in degrees
and radians.
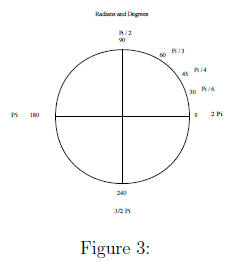
Converting Degrees to Radians, and vice versa
Notice in the above figure that 180° = π radians.
Thus
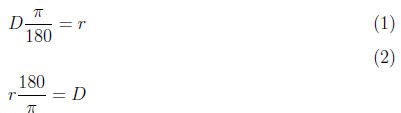
Examples
Fill in the Blanks
Degrees Radians
We could write a simple R function to convert degrees to radians.
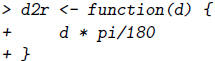
Exercise: Write a simple R function to convert radians to degrees.
What’s your sine?
In a later lecture we will discuss matrix rotations (e.g.,
when we discuss Factor Analysis,
Principle Components Analysis, etc.) and two important trigonometric functions
of angles:
(1) cosines and the (2) sines. Here is a quick review of these (and other)
functions.
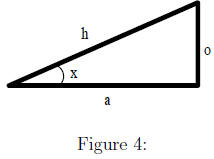
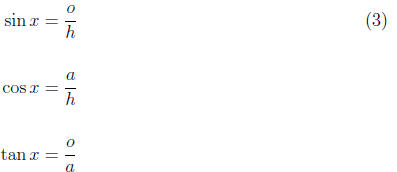
Note that these functions can be defined as the ratios of the sides of a right
triangle.
Representing correlations as vectors in space
Let’s return to the height and weight data from Chapter 2.
> options(width = 65)
> X1 <- matrix(c(57, 58, 60, 59, 61, 60, 62, 61, 62,
+ 63, 62, 64, 63, 65, 64, 66, 67, 66, 68, 69),
+ nrow = 20, ncol = 1)
> X2 <- matrix(c(93, 110, 99, 111, 115, 122, 110, 116,
+ 122, 128, 134, 117, 123, 129, 135, 128, 135,
+ 148, 142, 155), nrow = 20, ncol = 1)
> Z1 <- scale(X1)
> Z2 <- scale(X2)
> cor(Z1, Z2)
[,1]
[1,] 0.8670725
> plot(Z1, Z2, main = "Scatter plot of Height and Weight Data")
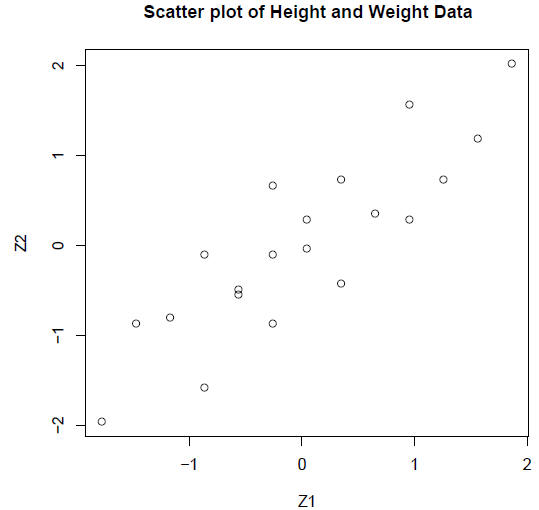
Notice that we have 20 pairs of data points for 2
variables: height and weight. The above
scatter plot shows how the data can be plotted in two dimensional space. The
paired
data fall within a relatively narrow ellipse, indicating that the data are well
described by
a linear correlation.
> library(ellipse)
> plot(ellipse(0.867), type = "l", main = "Scatter plot of Height and Weight
Data")
> points(Z1, Z2)
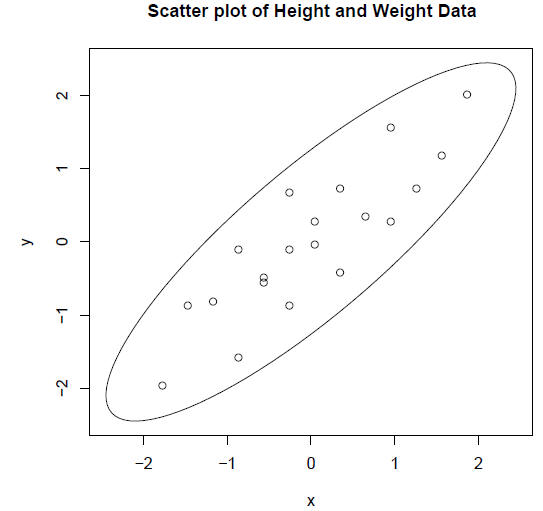
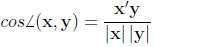
Alternatively, we can represent each variable (height and
weight) as vectors and depict the
correlation between the variables (vectors) as the cosine of the angle between
the vectors.
Specifically:
 (4)
(4)
In the above scatter plot we were working with z scores.
What is the vector norm (vector
length) of a set of z scores?
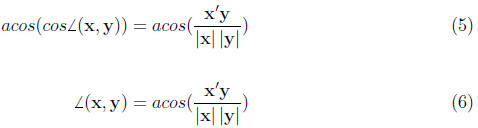
Representing Correlations as Angles
To find the angle that corresponds to a correlation we need to use inverse
trig functions.
Specifically, the arc cosine function. Remember that when you are using these
functions
the results will be reported in radians, not degrees.
What angle corresponds to the correlation between the height and weight data?